Product docs and API reference are now on Akamai TechDocs.
Search product docs.
Search for “” in product docs.
Search API reference.
Search for “” in API reference.
Search Results
results matching
results
No Results
Filters
Install and Use gping on Linux
Traducciones al EspañolEstamos traduciendo nuestros guías y tutoriales al Español. Es posible que usted esté viendo una traducción generada automáticamente. Estamos trabajando con traductores profesionales para verificar las traducciones de nuestro sitio web. Este proyecto es un trabajo en curso.
The gping tool takes the functionality of the ping tool and displays its data on a graph. With gping you can track the response time for hosts, and compare the data side by side. This guide shows you how to install gping and get started using it on your Linux system.
Before You Begin
If you have not already done so, create a Linode account and Compute Instance. See our Getting Started with Linode and Creating a Compute Instance guides.
Follow our Setting Up and Securing a Compute Instance guide to update your system. You may also wish to set the timezone, configure your hostname, create a limited user account, and harden SSH access.
sudo. If you’re not familiar with the sudo command, see the
Users and Groups
guide.What is gping?
gping is a Linux tool that provides the same functionality as ping with information displayed on a graph. If you need to measure the response time of a host over time, gping is a tool for the task. With gping, you can ping multiple hosts simultaneously, making it easy to compare response times. You can customize how your gping graph displays information and it is able to graph the execution time of Linux commands.
How to Install gping
This guide provides installation steps for Debian, Ubuntu, AlamaLinux, CentOS, and Fedora. Find the section below that corresponds to your system’s distribution to learn how to install gping.
Debian and Ubuntu
On Debian and Ubuntu distributions, use the following steps to install gping.
Install the
gnupgpackage, which is used for adding a repository key to APT:sudo apt install gnupgAdd the Azlux repository to APT. Replace
busterin the command below with the codename for your Debian release:echo "deb http://packages.azlux.fr/debian/ buster main" | sudo tee /etc/apt/sources.list.d/azlux.listOn Debian, you can find your release’s codename with the following command:
lsb_release -a | grep CodenameFor example, if you are on a Debian 10 system, the above command returns the following output:
Codename: busterOn Ubuntu, you can find the Debian codename with the command below:
cat /etc/debian_versionIf you are on an Ubuntu 20.04 system, the above command returns the following output:
bullseye/sidAdd the Azlux repository key to APT:
wget -qO - https://azlux.fr/repo.gpg.key | sudo apt-key add -Update the APT registry, and install
gping:sudo apt update sudo apt install gping
AlmaLinux, CentOS, and Fedora
On AlmaLinux, CentOS (8 and later), and Fedora, use the following steps to install gping.
Use the COPR plugin to enable the repository for
gping:sudo dnf copr enable atim/gpingInstall gping:
sudo dnf install gping
How to Use gping
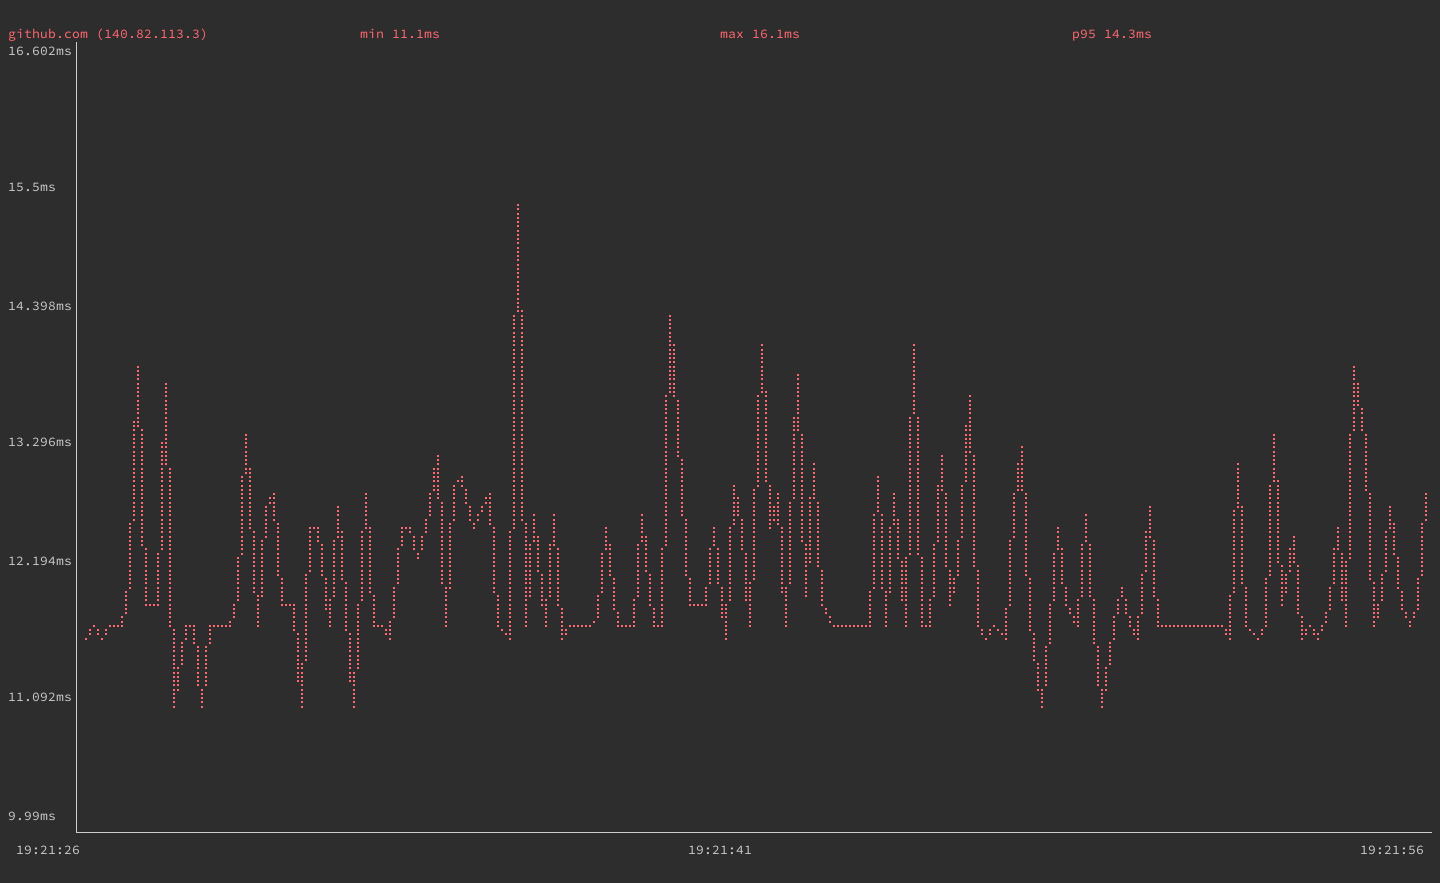
To use the gping, issue the gping command followed by a hostname or IP address. The example below pings github.com:
gping github.com

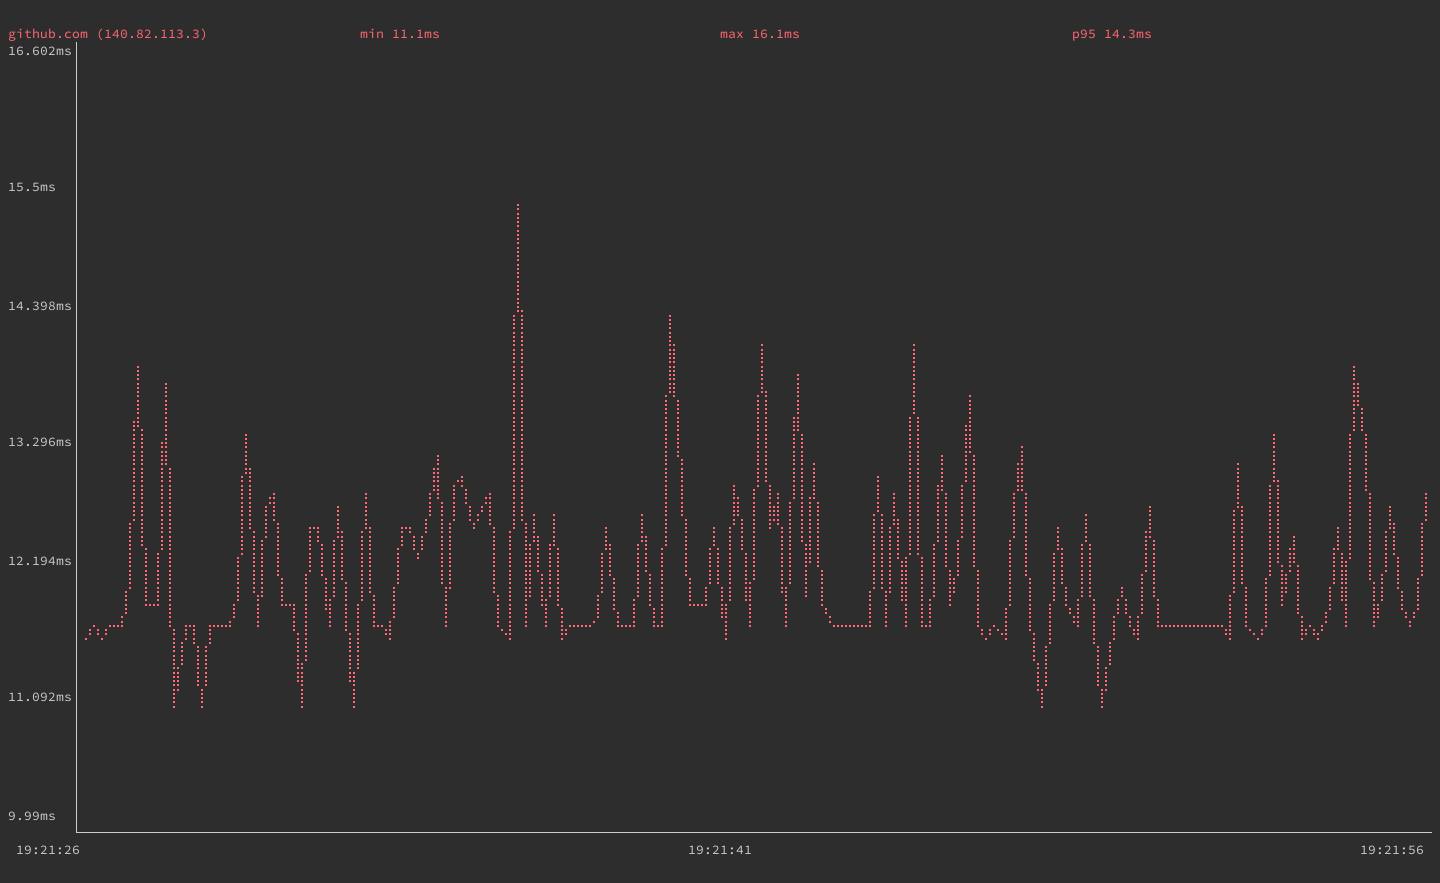
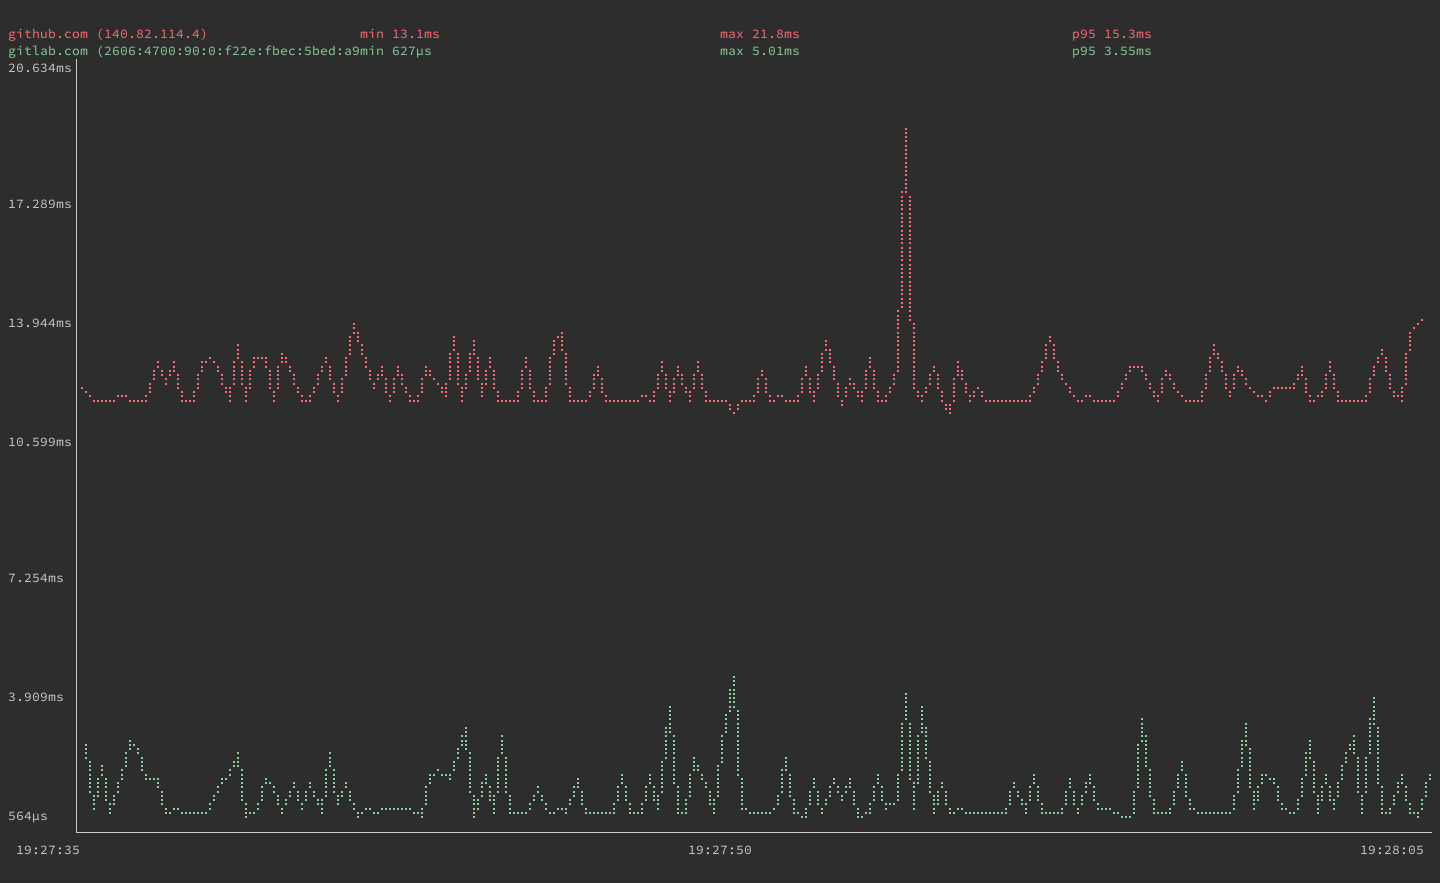
You can also use gping to graph multiple hosts’ ping times simultaneously. The next example pings github.com and gitlab.com, each graphed in a distinct color for readability:
gping github.com gitlab.com

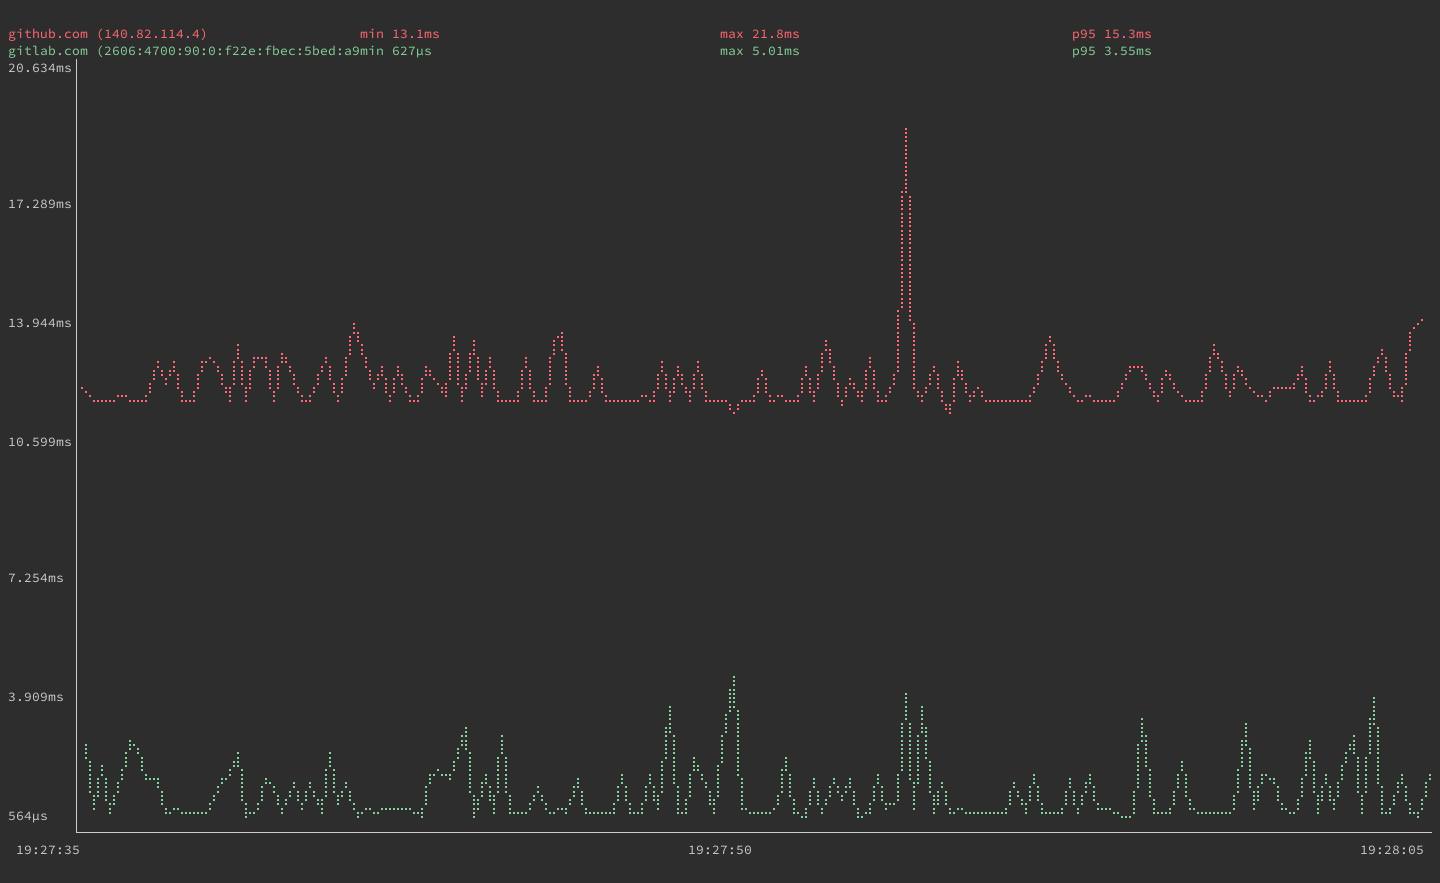
Should you need a specific kind of IP address resolution, gping supports -4 and -6 options for resolving addresses to IPv4 and IPv6, respectively.
gping provides options you can use to fine-tune its graph and also has an option to graph execution time of system commands. The next sections dive deeper into these command options and provide examples that show you how to use them.
Adjusting Display Options
gping gives you control over the following two aspects of its graph:
The buffer time, using the
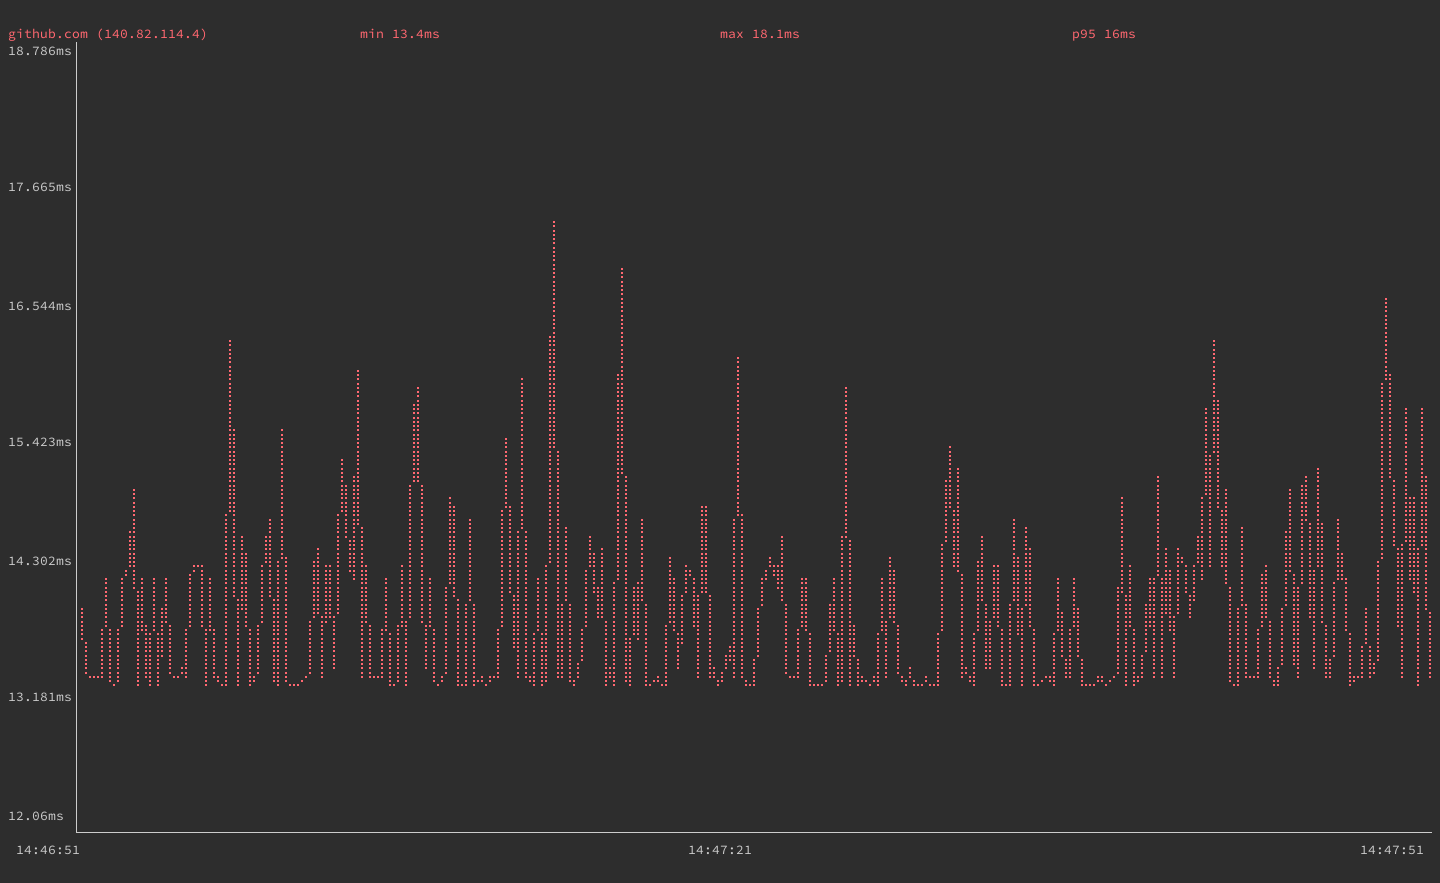
--bufferoption followed by a number of seconds. This determines how much time is shown on the graph screen. You can see in the screenshots above, from the times given below the graphs, that the default buffer time is 30 seconds.The watch interval, using the
--watch-intervaloption followed by a number of seconds, including fractions of a second. This controls how frequentlygpingmeasures ping time. The default is 0.5 seconds.
The example employs both of these options to alter the display. The command below has gping display 60 seconds at a time and has it graph the ping time of github.com once every second:
gping github.com --buffer 60 --watch-interval 1

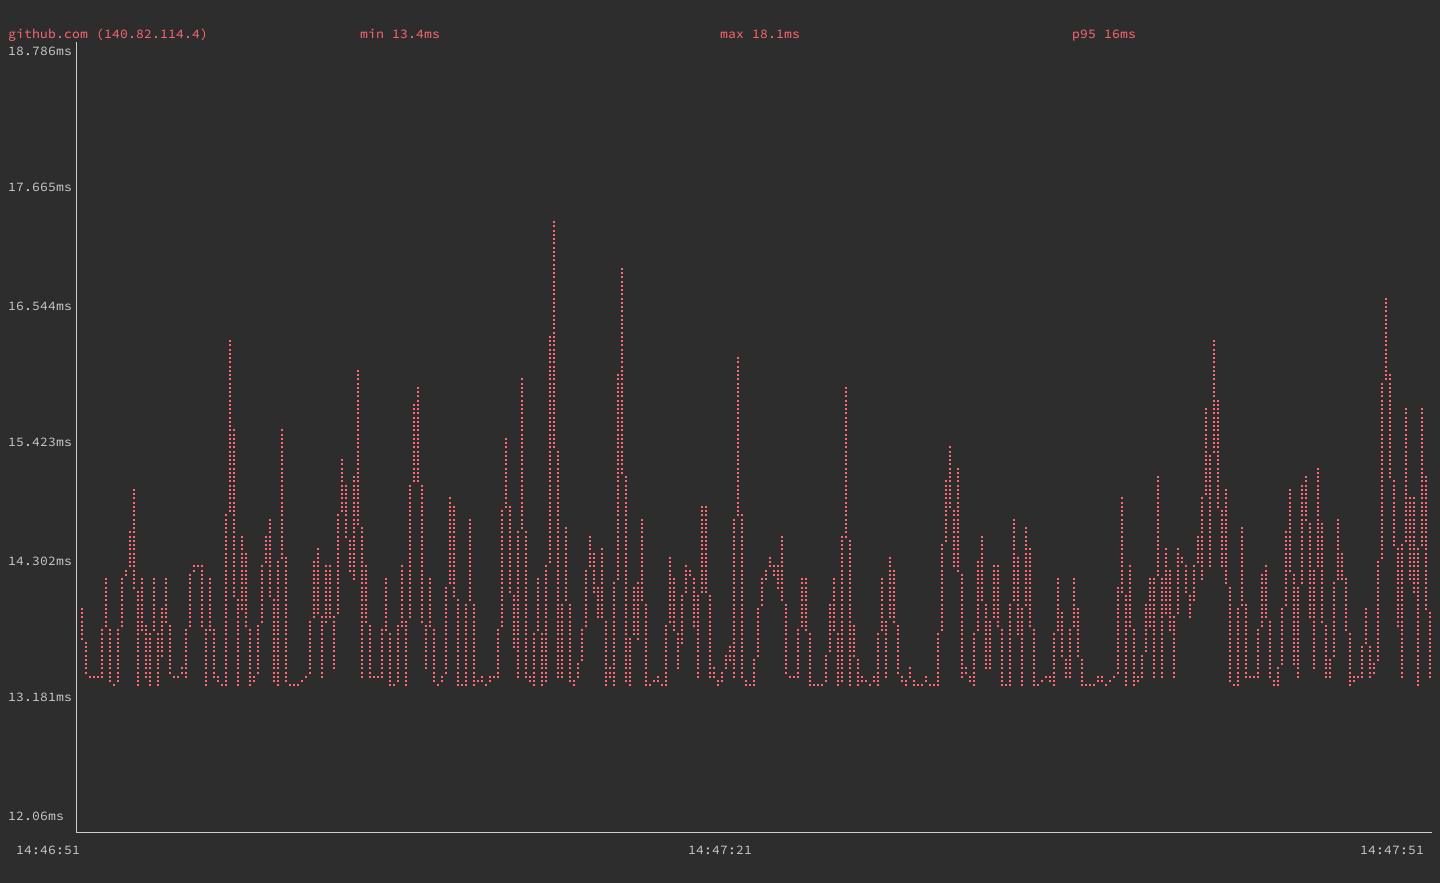
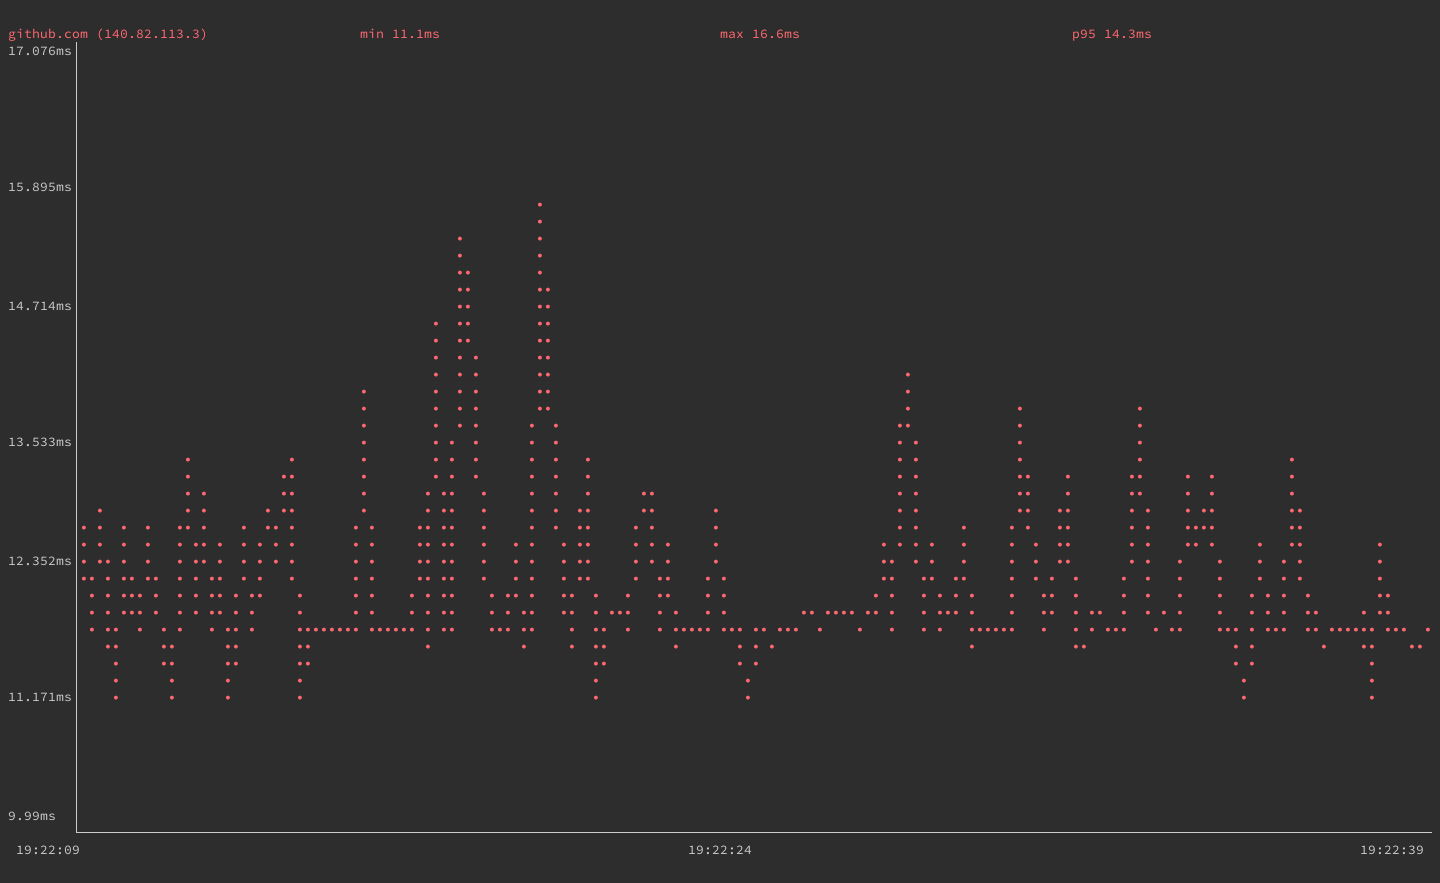
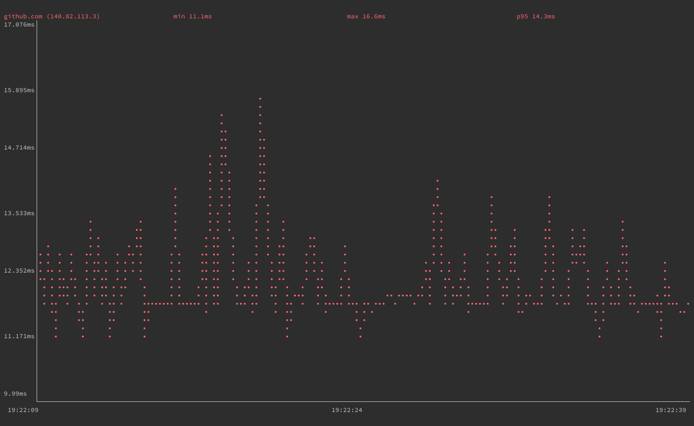
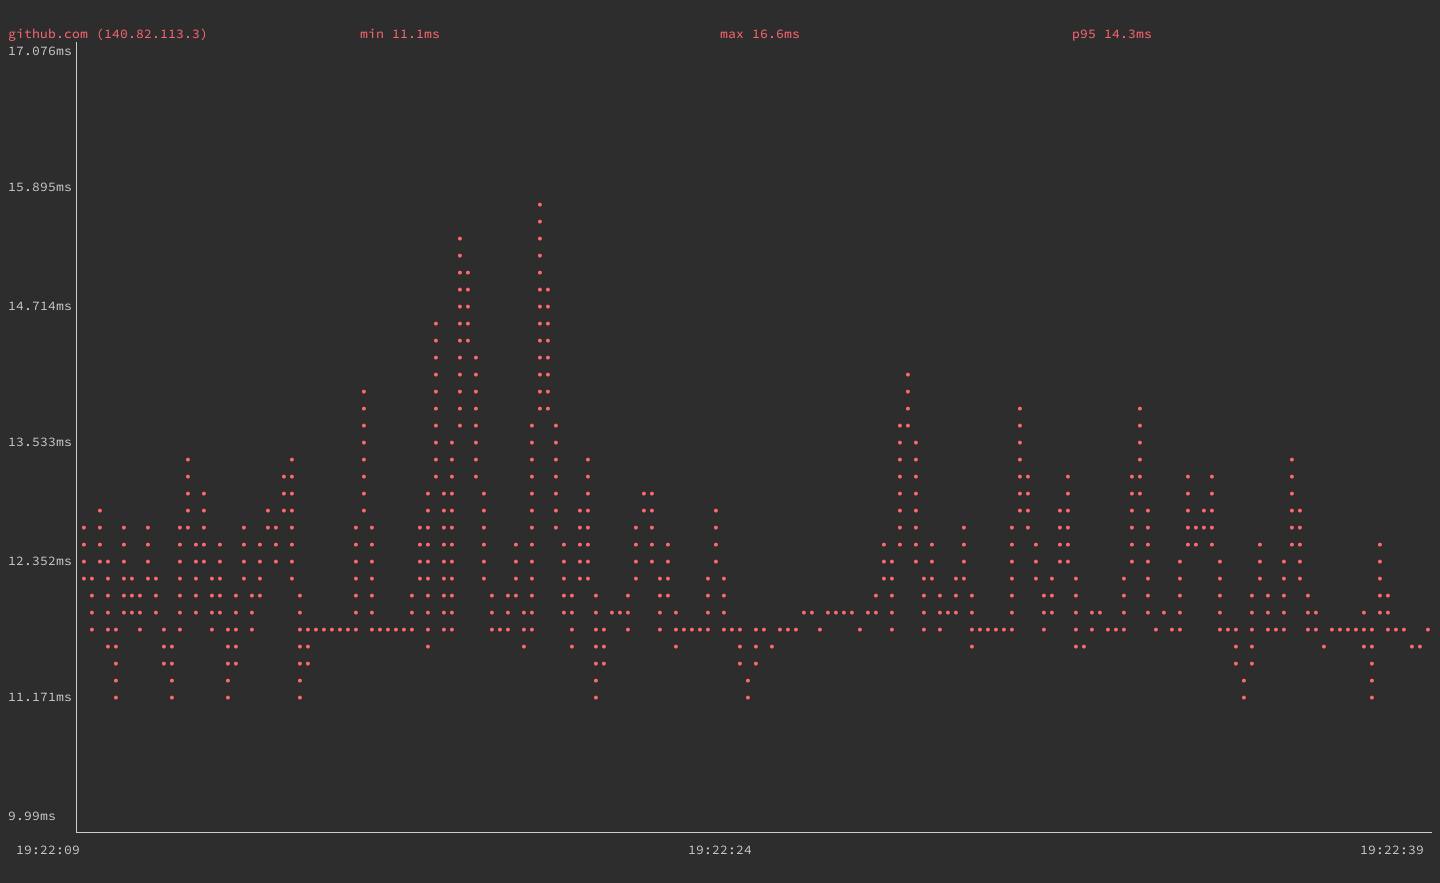
If you need to simplify how gping renders the graph line, you can use the option --simple-graphics. With this option, gping uses dot characters instead of braille to render its graph lines. This can be useful on terminals that do not support braille rendering:

Graphing Command Execution Time
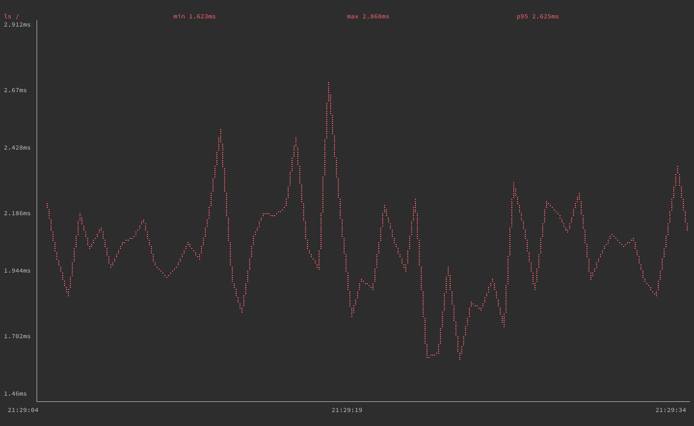
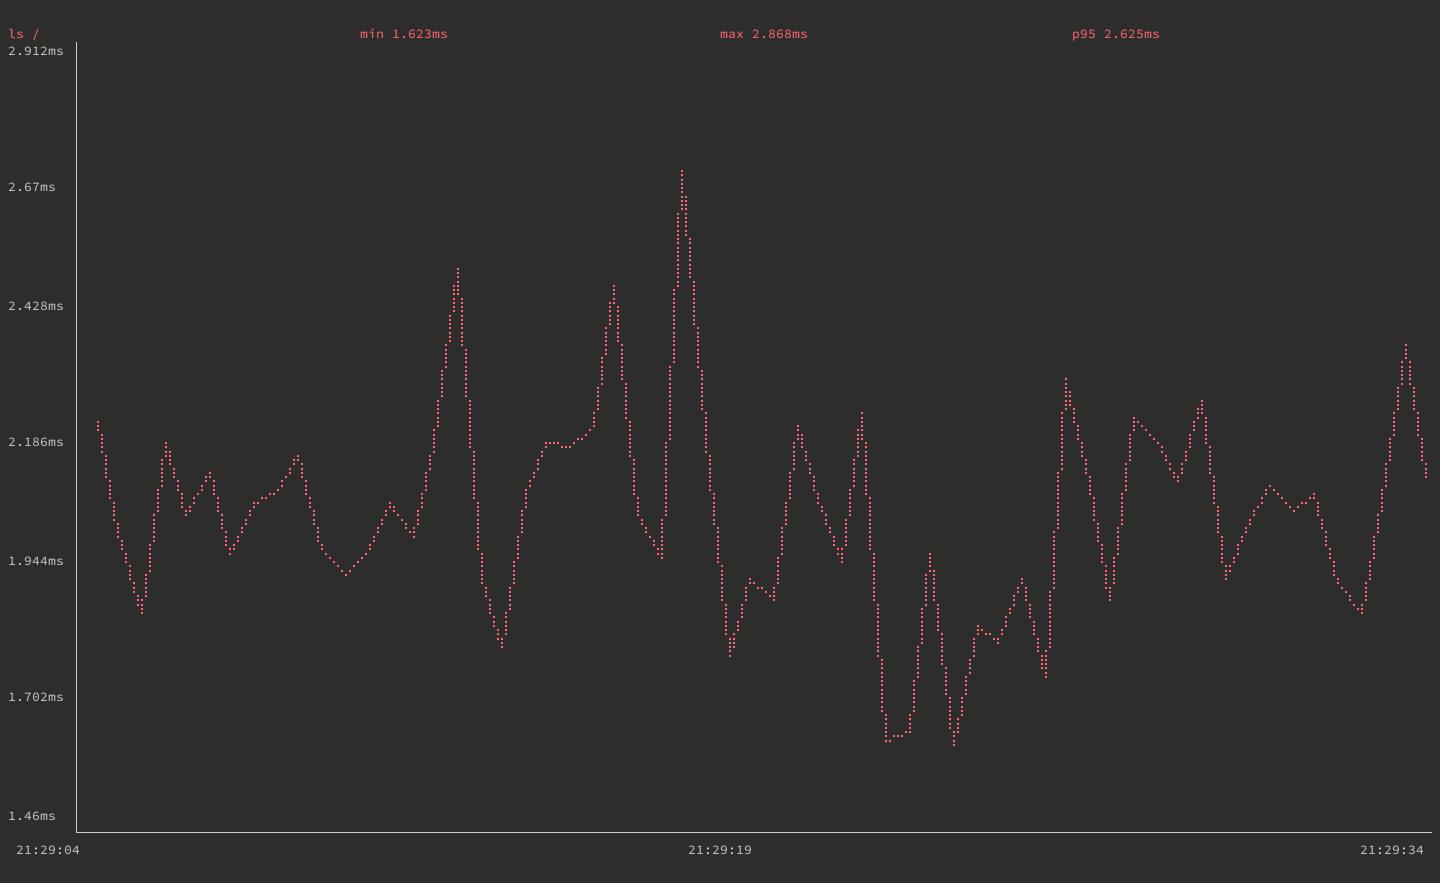
As a bonus feature, gping allows you to graph execution time for command-line commands. Using the --cmd option, gping lets you provide commands much as you would normally provide hostnames or IP addresses. For example:
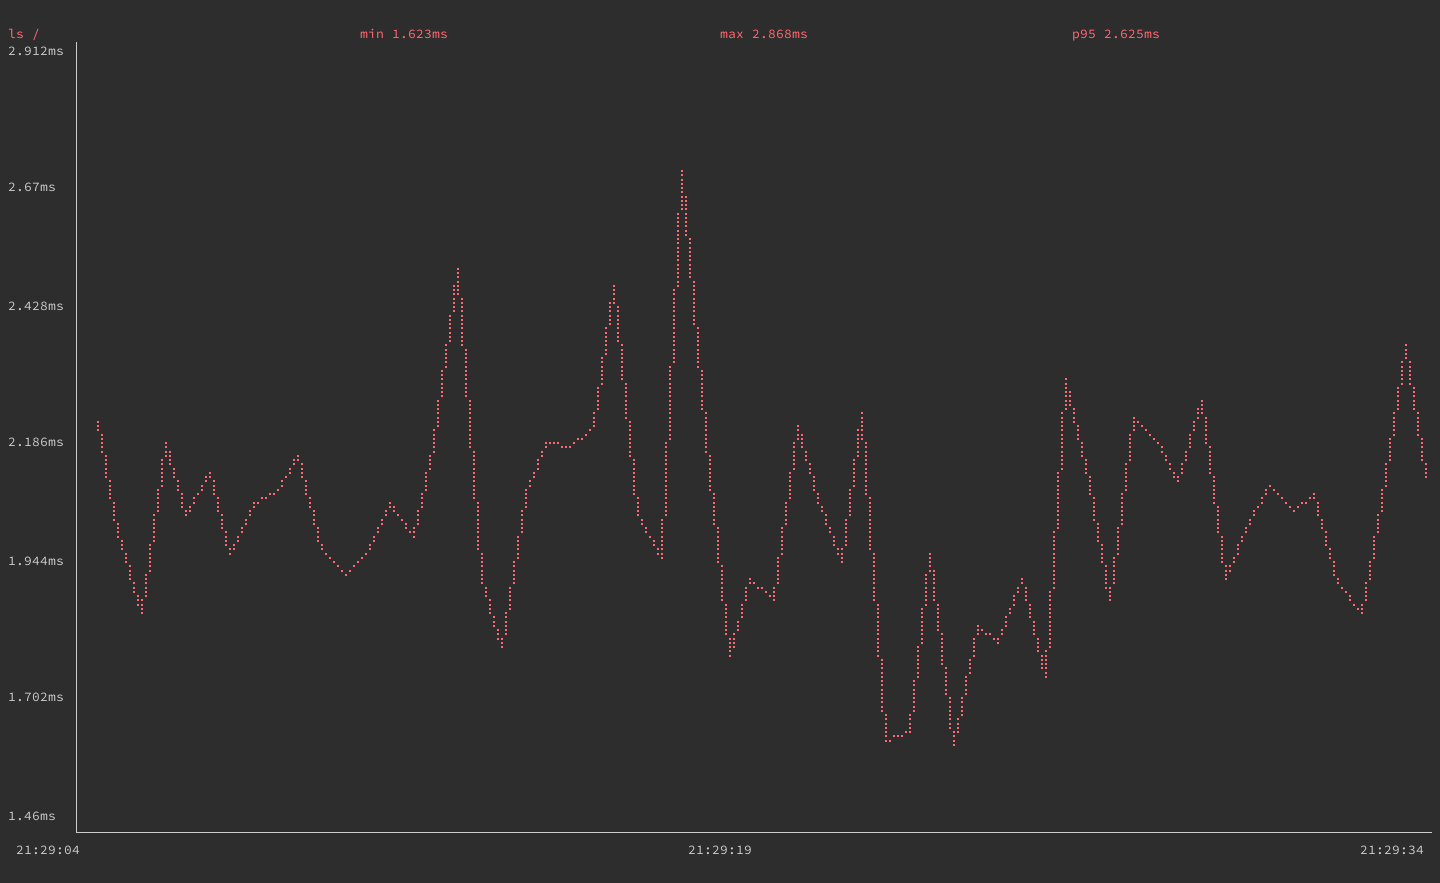
gping --cmd 'ls /'

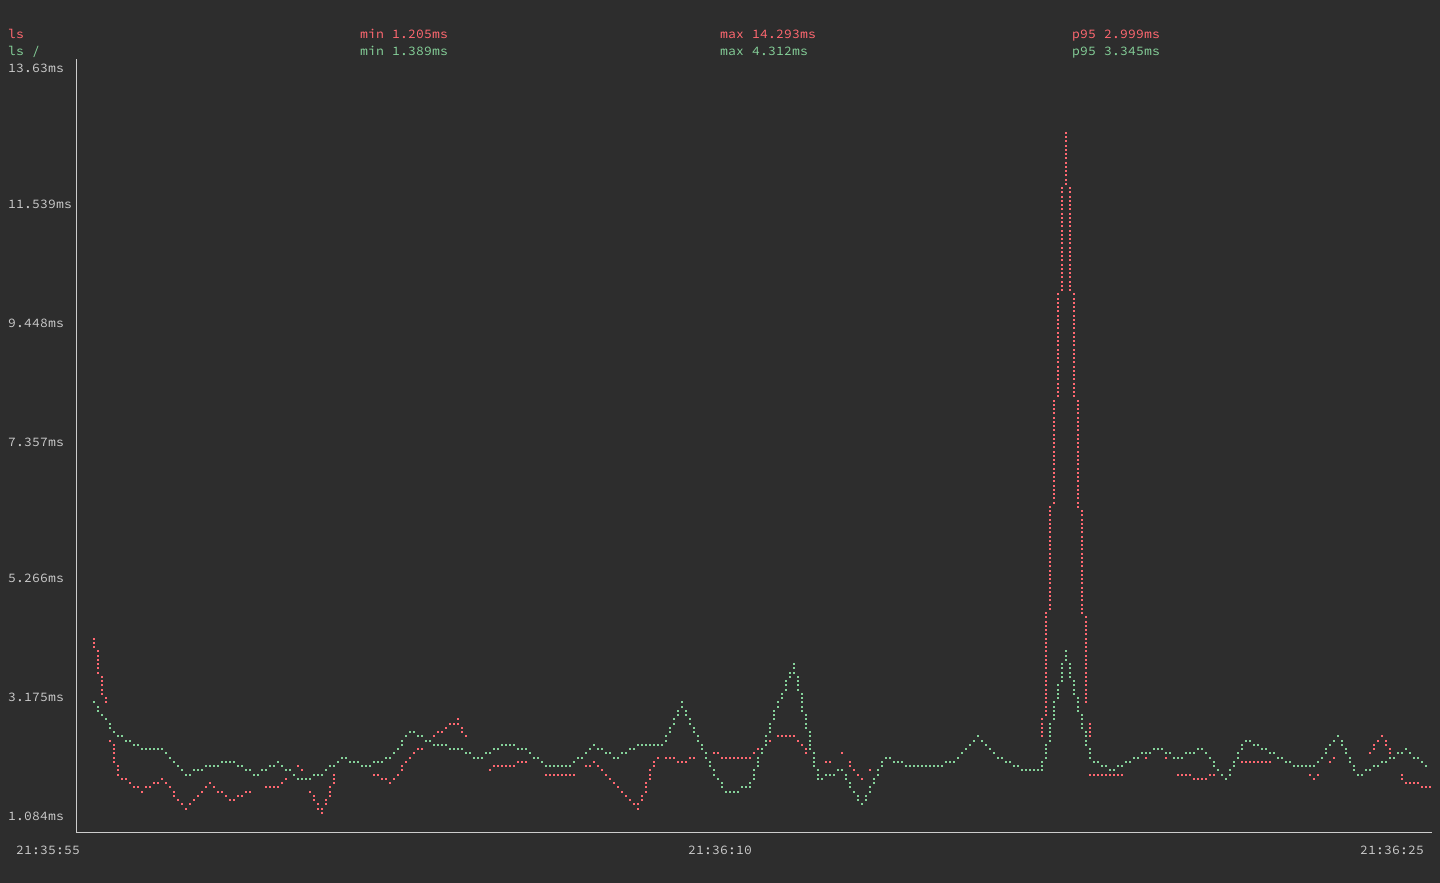
As with hosts, you can pass gping multiple commands when using this option to see the commands’ execution times graphed side by side:
gping --cmd 'ls' 'ls /'

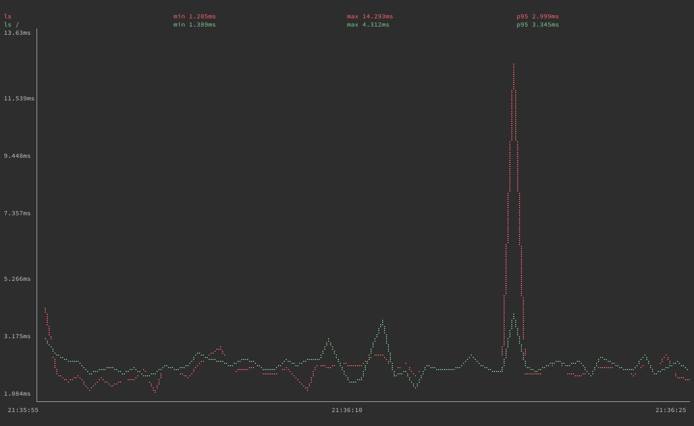
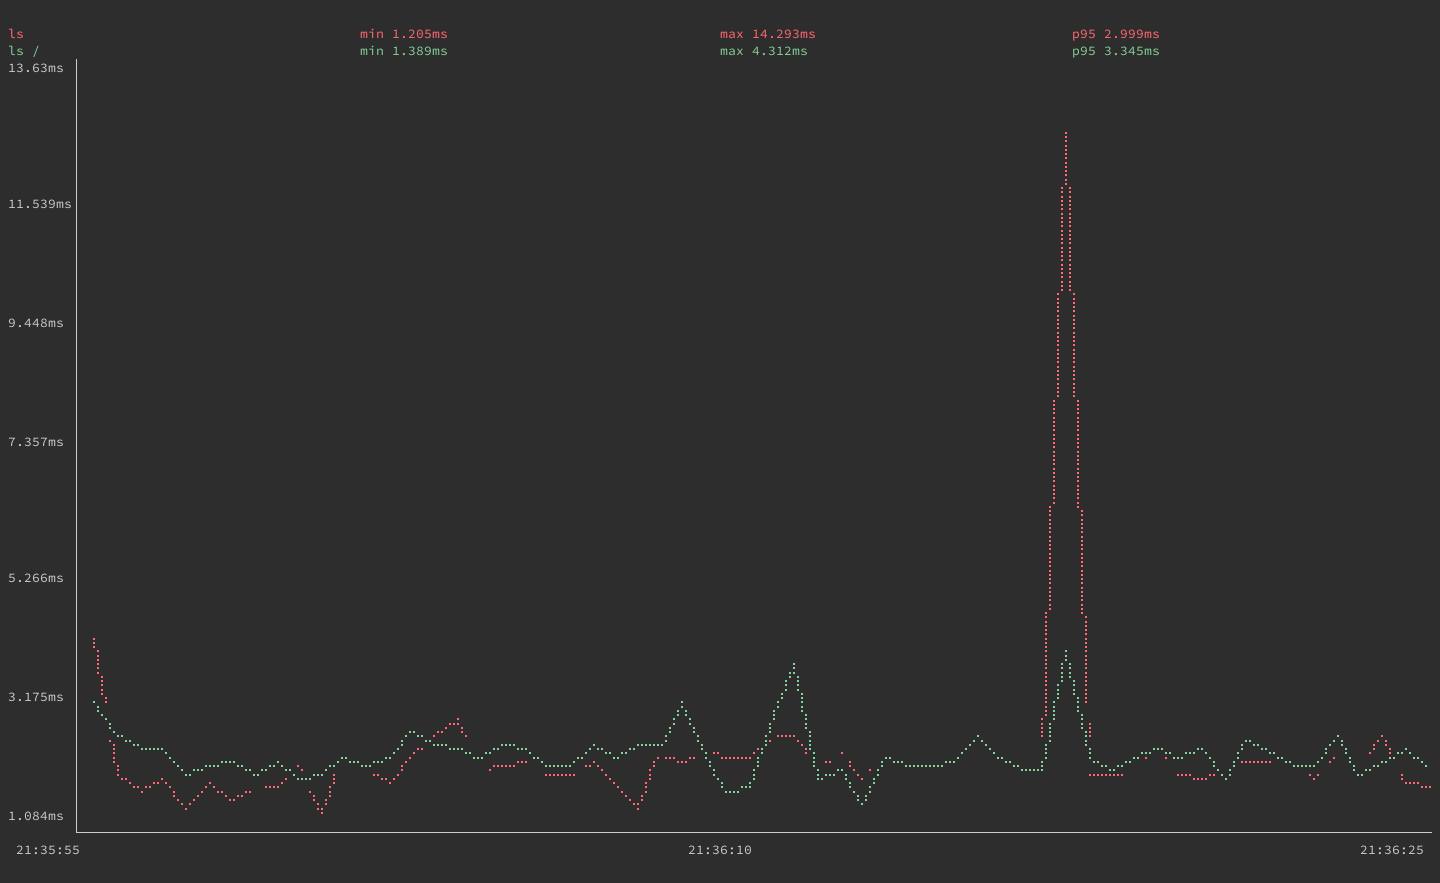
Since graphing command execution times is a bonus gping feature, it may not perform reliably for all kinds of commands. This is especially the case for commands that are more complicated.
If you are looking to measure a command’s performances, consider using the hyperfine tool. Hyperfine is a tool for benchmarking command-line commands, with an emphasis on clearly rendering side-by-side comparisons. If you are interested, check out our guide on getting started with hyperfine .
Conclusion
You are now ready to start using gping to measure response times. Due to the ping tool’s simplicity, gping might not fully replace it, however, gping fills a highly useful niche. If you need to measure a host’s response times over some duration, it is useful to have gping installed and ready on your system.
This page was originally published on

